AHP Trees
An AHP Tree, or Simple AHP Hierarchy is a tree of criteria, with alternatives at the bottom. An example looks like:
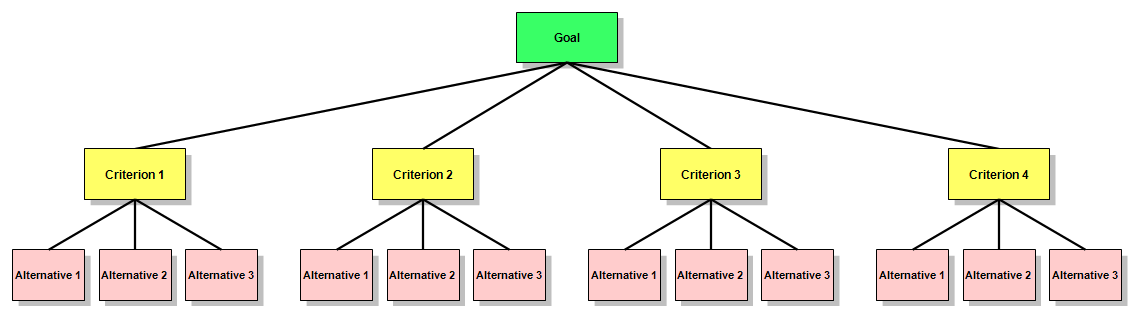
In pyanp we work on such structures with the pyanp.ahptree module.
AHP Tree usage in pyanp
In this tutorial we will:
- Show you how to import the AHPTree class (which is what handles all AHP tree calculations)
- Read in a full AHP tree’s data from a single excel spreadsheet
- Show some standard calculations and their results
- Resources for this tutorial
1. Importing the AHPTree class
And a few other classes you will need for later parts of this tutorial
# Pandas has DataFrames and Series, very useful things
import pandas as pd
# numpy has lots of useful things in it
import numpy as np
# lastly import our ahptree python code.  If you haven't already installed the pyanp library do
# pip install pyanp
# to get it
from pyanp import ahptree
2. Loading data from an excel file
excel_file = 'PATH_TO_YOUR_EXCEL_FILE'
ahp = ahptree.ahptree_fromdf(excel_file)
3. Some standard AHP calculations
3.1 The global priorities for all users and the overall
gs = ahp.global_priority_table()
gs
| Group | Bill | John | Joseph | Ronald | Leanne | Blythe | |
|---|---|---|---|---|---|---|---|
| Goal | 1.000000 | 1.000000 | 1.000000 | 1.000000 | 1.000000 | 1.000000 | 1.000000 |
| A | 0.241823 | 0.191670 | 0.357156 | 0.167712 | 0.064374 | 0.073360 | 0.714286 |
| A1 | 0.061971 | 0.011303 | 0.142862 | 0.041904 | 0.008701 | 0.008887 | 0.405327 |
| A2 | 0.078277 | 0.037579 | 0.142862 | 0.015989 | 0.032055 | 0.058384 | 0.053618 |
| A3 | 0.101575 | 0.142788 | 0.071431 | 0.109819 | 0.023618 | 0.006088 | 0.255340 |
| B | 0.321400 | 0.054852 | 0.234003 | 0.235756 | 0.679480 | 0.726685 | 0.142857 |
| B1 | 0.154726 | 0.009142 | 0.033429 | 0.039293 | 0.509610 | 0.645942 | 0.114286 |
| B2 | 0.166674 | 0.045710 | 0.200574 | 0.196463 | 0.169870 | 0.080743 | 0.028571 |
| C | 0.436777 | 0.753478 | 0.408841 | 0.596533 | 0.256146 | 0.199955 | 0.142857 |
| C1 | 0.116491 | 0.251159 | 0.045427 | 0.074567 | 0.224128 | 0.019996 | 0.035714 |
| C2 | 0.320286 | 0.502318 | 0.363414 | 0.521966 | 0.032018 | 0.179960 | 0.107143 |
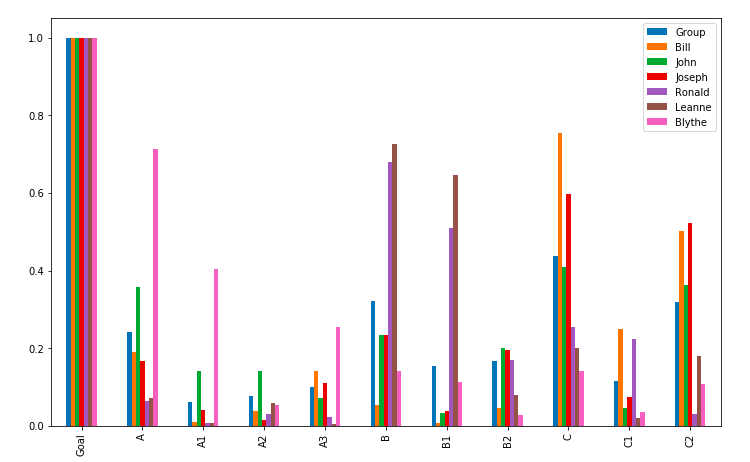
3.2 Let’s graph the global priorities
gs = ahp.global_priority_table()
gs.plot(kind="bar")
3.3 Now let’s get the synthesized alternative scores
altscores = ahp.priority_table()
altscores
| Group | Bill | John | Joseph | Ronald | Leanne | Blythe | |
|---|---|---|---|---|---|---|---|
| Alt1 | 0.356952 | 0.400781 | 0.438441 | 0.337148 | 0.256614 | 0.226740 | 0.509450 |
| Alt2 | 0.645187 | 0.604409 | 0.644722 | 0.554433 | 0.707354 | 0.733468 | 0.851045 |
| Alt3 | 0.533711 | 0.450100 | 0.512404 | 0.477552 | 0.629131 | 0.476311 | 0.681823 |
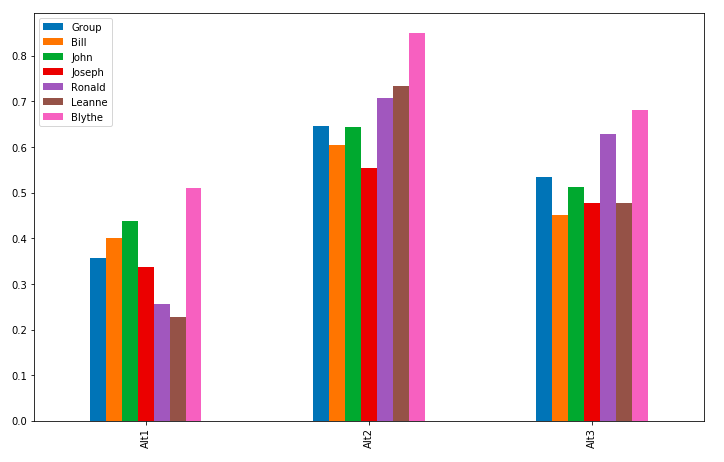
3.4 Let’s graph the synthesized alternative scores
altscores = ahp.priority_table()
altscores.plot(kind="bar")
3.5 Inconsistencies for all users and the group
allincons = ahp.incond_std_table()
allincons
| Group | Bill | John | Joseph | Ronald | Leanne | Blythe | |
|---|---|---|---|---|---|---|---|
| Goal | 0.056856 | 6.982872e-01 | 2.689665 | 1.767344e+00 | 0.164491 | 0.008849 | -8.540177e-16 |
| A | 0.239585 | 5.580869e-01 | 0.480769 | 7.068608e-02 | 0.090399 | 0.096090 | 4.028993e-01 |
| B | 0.000000 | 4.440892e-16 | 0.000000 | 4.440892e-16 | 0.000000 | 0.000000 | 0.000000e+00 |
| C | 0.000000 | 0.000000e+00 | 0.000000 | 0.000000e+00 | 0.000000 | 0.000000 | 0.000000e+00 |